Inside the US Treasury HAMP 2015.01 Data Dump: Fun with Loan Modification Approval Rates
It’s no secret that many people who applied for a loan modification were unable to obtain one. Some people received the run around as banks lost their paperwork over and over. Others received a trial modification but not a permanent one. Some people simply weren’t eligible.
The fields ln_st_nme and ln_mdfc_mode_nme in the data dump tell this story:

Only rows 2 and 6 are good outcomes. This article concentrates on the rate of row 2 “Active Payment - Official Modification” outcomes, about 1 million out of the 6+ million total requests.
A recent public data dump, together with the capabilities of Google BigQuery, allows a deeper look at the approval rates for loan modification requests.
Loan Modification Approvals Percentages by MSA State

Active is the number of official, permanent modifications with active payment
Total is the number of all requests, including rejected requests, cancellations, trials and permanent.
Approval percentage is a percentage calculated as 100 x Active / Total
Puerto Rico is the surprising entry on this list . Even though the number of applications and official modifications is small, there’s no obvious explanation why it should be easier for someone to get a loan modification approval in Puerto Rico, as opposed, to say, Hawaii, which had about than twice as many applications but fewer finished official, permanent modifications.
DC is not exactly a surprise. Putting cynicism aside for a moment, the place is full of professionals who can navigate, or help others navigate, the government red tape involved in the loan modification program.
Bottom States

Among the bottom approval rates we find Texas, with a ~ 12% approval percentage for loan modifications. Texas has about as many active, permanent, official modifications as Arizona, about 33k. However, 272k Texans applied as opposed to 200k Arizonans.
What’s an MSA?
Practically, an MSA is an area around a city or town, identified by a code number such as 31080 for Los Angeles, or 12060 for Atlanta.
Technically, an MSA is a Metropolitan/Micropolitan Statistical Area, a group of counties identified by the federal government (probably the census bureau) as representing a named area.
In the HAMP data dump, a row is tagged with either an MSA code number (~5.8 million records) or a state (~419,000 records) or nothing (8 records) . Knowing both the state and MSA would be useful in state border regions such as New York City, Memphis, or Chicago as the MSA can cross state borders.
Best Approval Rates by MSA

Once again, Puerto Rico takes the lead, followed by the LA metro area and various California towns.
A Bit of Fun with Politics
Going back to our state-level data, we can also fetch whether Obama (D) or Romney(R) won the state in the 2012 Election and put that alongside the loan modification approval percentage.
2012 Presidential Election State by State

source: Wikipedia

Although the US political scene is not so simple or rigid as to put an entire state in the Democratic or Republican bucket based on the 2012 election, for the sake of argument we see 8 (D) states getting the top 10 loan modification approval rates and only 2 (R) states in the top 10.
And if we look at the bottom 10 states by loan modification approval percentage…

we see 9 (R) states at the bottom of the rankings and only 1 (D) state.
From this, what can a hypothetical talk-radio host conclude? Probably not much. Certainly none of these things:
- that the (D) states are being paid off for voting (D), at the expense of the (R) states [**]?
- that (R) folks have a better chance attracting a tax audit than receiving a loan modification[**]?
- that the (R) folks are sabotaging the loan modification process in some states [**]?
- that people who needed a loan modification voted, in 2012, for the party that would give them one[**]?
[**] except Utah and Arizona of course.
After all, correlation does not prove causation.
There can be unknown factors creating these effects that are also correlated with politics.
Speaking of correlation, if we use 2012 popular vote, % Romney - % Obama, to put each state on a left-right axis, we get this pretty plot:
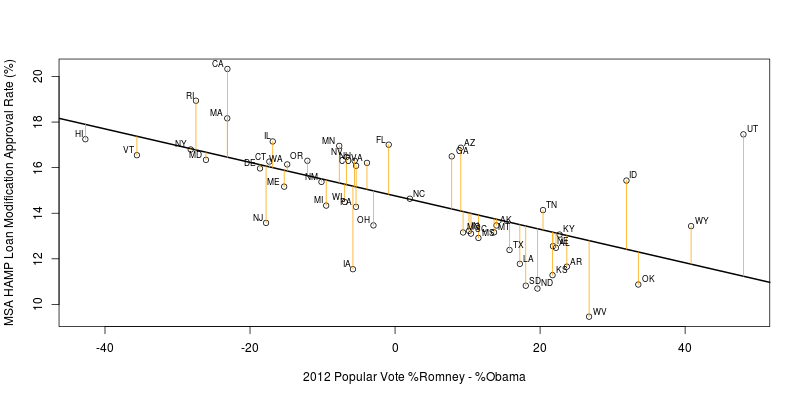
The R^2 for the linear fit is around 0.40, meaning that about 40% of the variance is explained by the linear model (leaving 60% unexplained…)
Once again, remember, correlation does not prove causation.
R provided this summary of the linear model shown in the chart.
Call:
lm(formula = hamp_approval_rate ~ 1 + popular_vote2012, data = df)

Residuals:
    Min      1Q  Median      3Q     Max
-3.6433 -0.9806 -0.3023  1.1444  6.2260

Coefficients:
                 Estimate Std. Error t value Pr(>|t|)
(Intercept)      14.76049    0.26599  55.492  < 2e-16 ***
popular_vote2012 -0.07342    0.01307  -5.618 9.54e-07 ***
---
Signif. codes:  0 ‘***’ 0.001 ‘**’ 0.01 ‘*’ 0.05 ‘.’ 0.1 ‘ ’ 1

Residual standard error: 1.875 on 48 degrees of freedom
Multiple R-squared:  0.3967,    Adjusted R-squared:  0.3842
F-statistic: 31.57 on 1 and 48 DF,  p-value: 9.544e-07
The queries, raw data, and R scripts for this are in this github repository for those who would like to use these files as a basis for other explorations, commentary, or improvement.
Totalling Savings to Borrowers
The data dump contains fields for borrower monthly housing expense before and after the modification. These fields do not always contain any numbers, or numbers that make sense, so we restrict the data to permanent modifications where these numbers take on somewhat reasonable values (I used up to $10,000/mo, which might seem a bit high for a house payment plus miscellaneous – but there are hundreds of entries that are higher) and eliminate any reports showing zero or negative savings.

The California savings of $209 million/month dwarfs the #2 and #3 states of Florida and New York that are tied at around $72 million/month saved on housing expenses. Other states in the top 12 come in from $10-$30 million/month saved.
The top average savings per borrower/mod studied goes to HI with $1008/mo (off chart), then NY ($910/mo), CA ($857/mo), DC ($769/mo)

The bottom end of the savings list dips under $100K/month total saved, with average savings in the $300/mo-$500/mo range.
Data Issues
I've heard that there are data issues with some fields in the HAMP data dump. Some of these are mentioned in the data dictionary and users guide. I've also seen reports of higher HAMP approval rates than the measly 10-20% we see here.
Here's a document that says the number is more like 30% but it includes, in the fine print, trials that do not become permanent modifications:
HAMP Application Activity by Servicer Jan 2015
So, take what you read here with a grain of salt. If anyone has further insight about the data issues, please, explain in the comments section.
No comments:
Post a Comment
Note: Only a member of this blog may post a comment.